Free Text-to-Diagram Editor: Create Flowcharts, Sequence Diagrams & More
Introducing our new diagram editor that turns simple text into professional flowcharts, sequence diagrams, Gantt charts, and more. No signup required, shareable via URL, and works entirely in your browser.
If you've ever tried to create a quick diagram for documentation or a code review, you know the pain. Fire up a diagramming app, drag boxes around, try to get the arrows to connect properly, export it, realize you need to change something, repeat. It's a whole thing.
That's why we built a text-to-diagram editor that takes a different approach. You write simple text describing your diagram, and it renders instantly. No dragging, no fiddling with alignment, no account required.
How It Works
The editor uses Mermaid syntax, which is essentially markdown for diagrams. If you've ever added a diagram to a GitHub README or a Notion page, you've probably seen it before. The syntax is straightforward enough that you can pick it up in a few minutes.
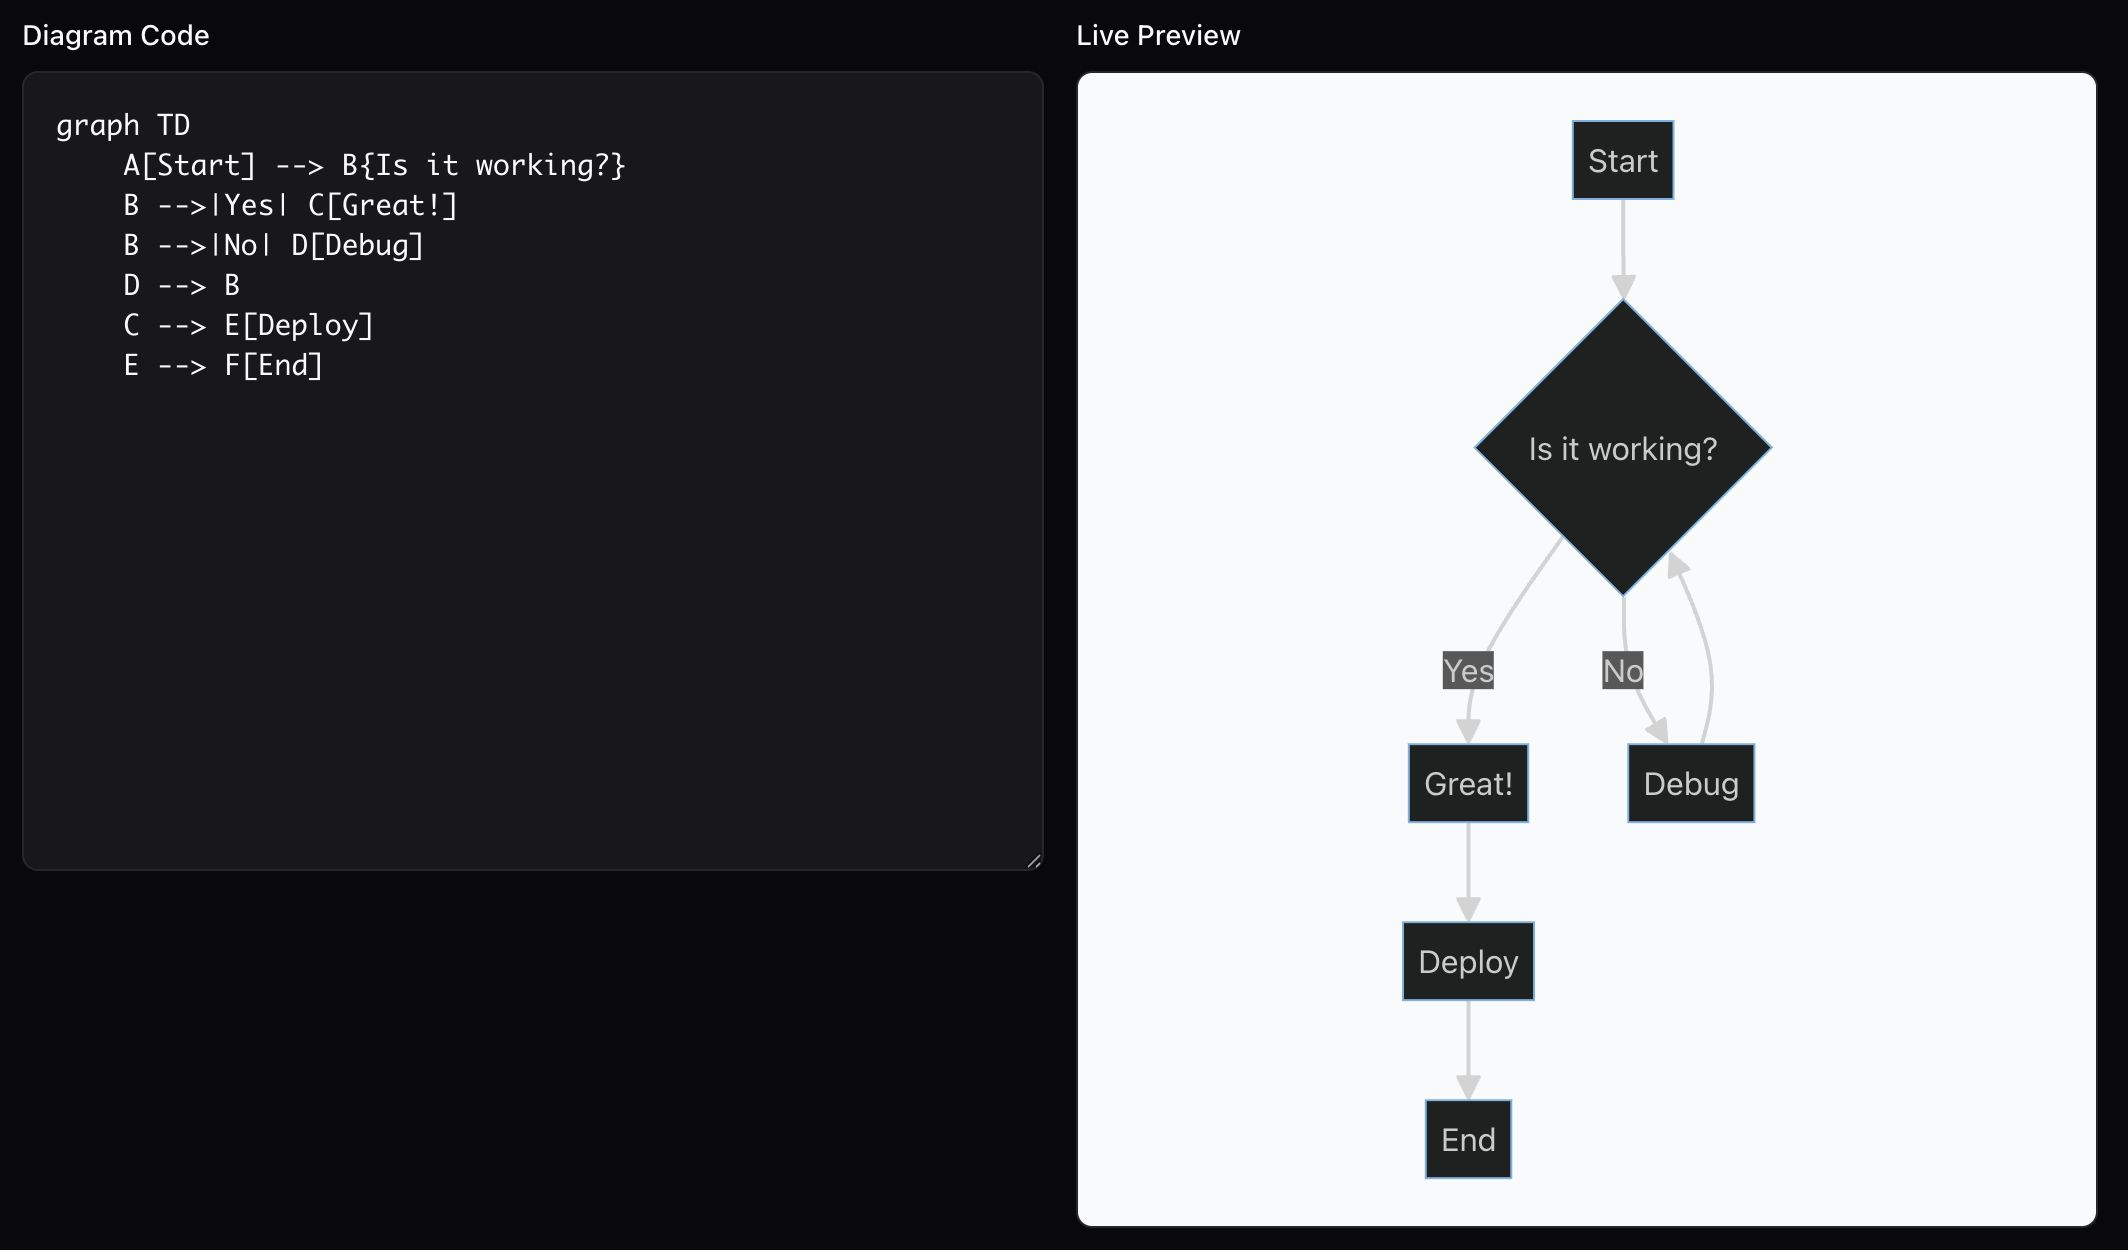
Here's a simple flowchart:
flowchart TD
    A[Start] --> B{Is it working?}
    B -->|Yes| C[Ship it]
    B -->|No| D[Debug]
    D --> B
That text becomes a proper flowchart with boxes, arrows, and decision diamonds. Change the text, the diagram updates. No round-trips to a server, no waiting.
What You Can Create
The editor supports pretty much every diagram type developers actually use:
Flowcharts are the obvious one. Process flows, decision trees, user journeys. You can go top-to-bottom or left-to-right, add labels to arrows, and nest subgraphs for complex flows.
Sequence diagrams show interactions over time. Perfect for documenting API calls, microservice communication, or just explaining how different parts of a system talk to each other.
Class diagrams let you visualize object-oriented structures. Classes, interfaces, inheritance, associations. Useful for planning before you code or documenting what already exists.
ER diagrams handle database schemas. Tables, columns, relationships. Way faster than drawing them by hand when you're designing a new feature.
Gantt charts work for project planning. Tasks, timelines, dependencies. Not as full-featured as dedicated project management tools, but good enough for sprint planning or roadmap presentations.
There's also state diagrams, git graphs, mind maps, pie charts, timelines, and quadrant charts. Basically if you need to visualize something for technical documentation, there's probably a diagram type that fits.
The URL Sharing Thing
This is my favorite part. When you create a diagram, you can generate a shareable URL. The entire diagram is encoded directly in the URL itself. No database, no accounts, no "you need to sign up to share."
Click Share, get a URL, paste it in Slack or your PR description or wherever. Anyone who clicks it sees your diagram and can edit their own copy. The URL contains everything.
The tradeoff is that really complex diagrams create really long URLs. If you're hitting browser limits, simplify or split into multiple diagrams. The tool warns you when URLs get too long.
Why Text-Based Diagrams Make Sense
There's a reason this approach has caught on with developers. Diagrams-as-code means your diagrams can live in the same repo as your code. They're version controlled. You can review changes in a PR. When someone updates the architecture, the diagram update is right there in the diff.
It also means diagrams are reproducible. No more "I made this in Visio three years ago and nobody can find the source file." The source is the text, and the text is probably in a README somewhere.
And honestly, it's just faster. Once you know the syntax, typing out a flowchart takes a fraction of the time that dragging boxes around does. Especially when you need to make changes later.
Export Options
The editor exports to PNG and SVG. PNG works for Slack, presentations, anywhere you need a simple image file. SVG scales infinitely without quality loss, so it's better for web pages or print.
Both exports render at high resolution with a white background, so they look clean wherever you use them.
Give It a Try
The diagram editor is free, runs entirely in your browser, and requires no signup. Your diagram code never leaves your device unless you share a URL.
Start with one of the templates to see how the syntax works, then modify it for your use case. You'll probably have a working diagram in under a minute.
Related Tools
More Articles
AI Is Killing Ad Revenue. That's Also AI's Problem.
AI chatbots are wiping out publisher traffic and ad revenue at a scale that's hard to overstate. But here's the part the industry keeps dancing around: if the web dies, AI gets dumber. This is a problem both sides need to solve.
Is Claude or ChatGPT Crawling Your Site Right Now?
Your Google Analytics shows normal traffic. Meanwhile AI crawlers are silently hitting your site hundreds of times a day. Here's how to find them in your server logs, verify they're real, and decide what to do about it.
AI Is Killing Web Traffic (And It Might Destroy Itself Because of It)
Zero-click searches now account for 65% of Google queries. Publishers are losing 30–90% of their traffic. If the open web collapses, AI loses the one thing it needs most: fresh, human-written content to learn from.